Process Control Metrology
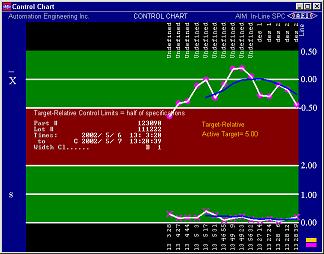 AEI has a history of designing and building custom equipment for metrology. These machines were built primarily as tools to sort good parts from bad parts. The best way of determining if a part is good or bad is by accurately measuring the dimensions of the part. However, making a measurement of a single part is not adequate. After determining the size of a large quantity of parts, we begin to understand what features are difficult to control in manufacturing. At this point, determinations can be made about both the manufacturability of the part and about the manufacturing process itself. Making a measurement control chart plots the average (Xbar) and standard deviation of the parts measured. Each dot is the Xbar for one part. The most recent measurement is on the right side of the chart and as the data is updated the older data moves left. Measurements are divided into top side of the part and bottom side of the part. Top side measurements are yellow and bottom side measurements are pink. AEI has a history of designing and building custom equipment for metrology. These machines were built primarily as tools to sort good parts from bad parts. The best way of determining if a part is good or bad is by accurately measuring the dimensions of the part. However, making a measurement of a single part is not adequate. After determining the size of a large quantity of parts, we begin to understand what features are difficult to control in manufacturing. At this point, determinations can be made about both the manufacturability of the part and about the manufacturing process itself. Making a measurement control chart plots the average (Xbar) and standard deviation of the parts measured. Each dot is the Xbar for one part. The most recent measurement is on the right side of the chart and as the data is updated the older data moves left. Measurements are divided into top side of the part and bottom side of the part. Top side measurements are yellow and bottom side measurements are pink. 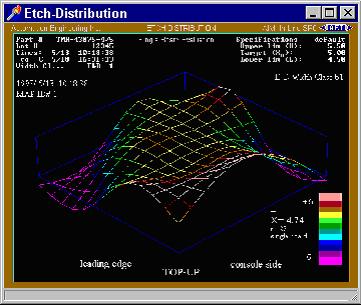 A white connecting line connects the Xbar dots creating a chart. A blue smoothing line shows the average of the last three Xbars. The control chart can be plotted with absolute measurements or with measurements compensated relative to zero. In absolute mode the mean is plotted. In the relative format each panel's mean is plotted relative to the target (mean minus target), and the control limits also have the target subtracted out. The advantage of plotting the mean corrected for the target is that vastly different conductor sizes can track together. An etch map, shown at right, is a perspective view of metrology measurements showing the distribution of across the X Y plane. Large measurements are plotted as hills and small measurements lines are plotted as valleys. A white connecting line connects the Xbar dots creating a chart. A blue smoothing line shows the average of the last three Xbars. The control chart can be plotted with absolute measurements or with measurements compensated relative to zero. In absolute mode the mean is plotted. In the relative format each panel's mean is plotted relative to the target (mean minus target), and the control limits also have the target subtracted out. The advantage of plotting the mean corrected for the target is that vastly different conductor sizes can track together. An etch map, shown at right, is a perspective view of metrology measurements showing the distribution of across the X Y plane. Large measurements are plotted as hills and small measurements lines are plotted as valleys.
|